


Running a small business without analytics is like driving blindfolded – you might move forward, but you’re missing crucial information that could accelerate your success. After working with hundreds of e-commerce businesses over the past eight years, I’ve seen firsthand how Shopify Analytics transforms struggling stores into profit-generating machines.
The difference between businesses that thrive and those that survive often comes down to one thing: making decisions based on data rather than gut feelings. Shopify’s built-in analytics platform gives you access to the same insights that million-dollar companies use, but most small business owners barely scratch the surface of what’s available.
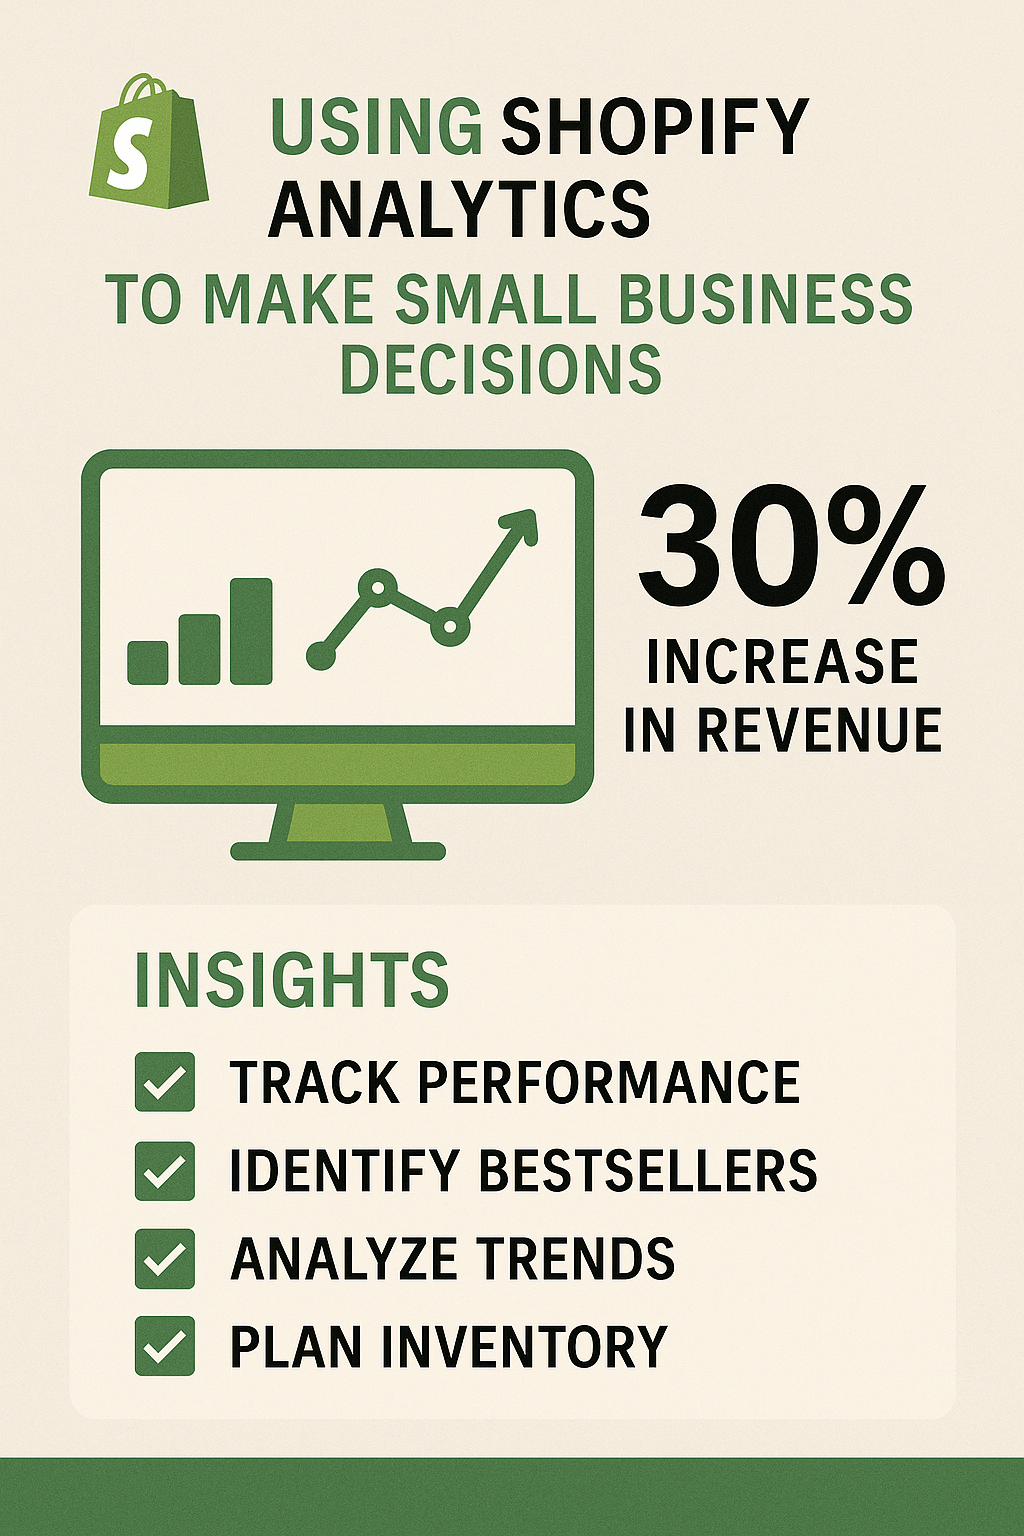
What Makes Shopify Analytics Essential for Small Business Growth?
Shopify Analytics isn’t just another dashboard filled with numbers – it’s your business intelligence center that reveals exactly what’s working and what’s draining your resources. Unlike generic analytics tools, Shopify’s system is specifically designed for e-commerce, meaning every metric directly relates to your bottom line.
Small businesses typically operate with limited budgets and resources, making every decision critical. When you’re spending $500 on Facebook ads or deciding which products to stock for the holiday season, you need concrete data to guide those choices. Shopify Analytics provides that foundation, turning guesswork into strategic planning.
The platform tracks everything from customer behavior patterns to inventory performance, giving you a complete picture of your business health. This comprehensive approach is particularly valuable for entrepreneurs who wear multiple hats and need quick access to actionable insights without spending hours analyzing spreadsheets.
How Do You Access and Navigate Shopify’s Analytics Dashboard?
Getting started with Shopify Analytics is straightforward, but knowing where to look for specific insights makes all the difference. From your Shopify admin panel, you’ll find the Analytics section in the main navigation menu, which houses four key areas: Overview, Reports, Live View, and Dashboards.
The Overview section provides your daily snapshot – think of it as your business morning briefing. Here you’ll see yesterday’s sales, visitor count, conversion rates, and top-performing products. This daily check-in takes less than two minutes but keeps you connected to your business pulse.
The Reports section is where the real magic happens for strategic decision-making. You’ll find detailed reports on sales, customers, marketing, and inventory. Each report can be customized by date range, allowing you to compare performance across different periods and identify trends that might not be obvious from daily observations.
Live View shows real-time activity on your store, including current visitors, their locations, and what they’re viewing. While this might seem like a novelty feature, it’s incredibly valuable for understanding customer behavior during product launches or marketing campaigns.
Which Key Metrics Should Drive Your Business Decisions?
Not all metrics are created equal, and focusing on the wrong numbers can lead to misguided decisions. Based on my experience optimizing hundreds of Shopify stores, five metrics consistently predict business success: conversion rate, average order value, customer acquisition cost, customer lifetime value, and inventory turnover rate.
Conversion rate tells you how effectively your store turns visitors into customers. The average Shopify conversion rate hovers around 1.4%, but top-performing stores often achieve 2-3% or higher. If your conversion rate is below 1%, it signals issues with your product presentation, pricing, or user experience that need immediate attention.
Average order value (AOV) reveals how much customers spend per transaction. Increasing AOV by just 10% can dramatically impact your profitability without requiring additional traffic. For example, if your current AOV is $50 and you increase it to $55, a store with 1,000 monthly orders generates an extra $5,000 in revenue.
Customer acquisition cost (CAC) shows how much you’re spending to gain each new customer through marketing efforts. If your CAC is $25 and your average customer only spends $30, you’re operating on razor-thin margins that leave little room for business growth or unexpected expenses.
Customer lifetime value (CLV) indicates the total amount a customer will spend with your business over their entire relationship. A healthy business maintains a CLV that’s at least three times higher than CAC. This ratio ensures you’re building sustainable growth rather than just breaking even on customer acquisition.
How Can Sales Reports Transform Your Product Strategy?
Sales reports in Shopify Analytics reveal patterns that can revolutionize your product strategy and inventory management. The Sales by Product report shows which items are your profit drivers and which are collecting digital dust, allowing you to make informed decisions about inventory investment and product promotion.
One of my clients, a boutique clothing store, discovered through their sales reports that their $200 dresses were outselling their $50 accessories by 400% in terms of revenue, despite the accessories having higher quantities sold. This insight led them to shift their marketing budget toward promoting higher-priced items, resulting in a 35% increase in monthly revenue within three months.
The Sales by Traffic Source report breaks down which marketing channels generate the most revenue, not just traffic. You might find that while social media brings the most visitors, email marketing converts at a much higher rate. This information helps you allocate your marketing budget more effectively and focus on channels that deliver actual sales rather than vanity metrics.
Seasonal trends become crystal clear through sales reports when you analyze data over extended periods. Understanding that your sales typically spike 60% in November and drop 40% in January allows you to prepare inventory, adjust marketing spend, and manage cash flow accordingly.
What Do Customer Analytics Reveal About Your Market?
Customer analytics provide insights that go far beyond basic demographics, revealing behavioral patterns that can inform everything from product development to marketing messaging. The Customer reports section shows you who your buyers are, where they come from, and how they interact with your brand.
Geographic data helps you understand your market reach and can reveal unexpected opportunities. A home goods store I worked with discovered that 30% of their orders came from rural areas, despite their marketing being focused on urban customers. This insight led to a successful rural-focused marketing campaign that increased their customer base by 25%.
The Customers by Orders report identifies your most valuable customers and shows shopping frequency patterns. Customers who place multiple orders are worth significantly more than one-time buyers, so understanding what motivates repeat purchases helps you create targeted retention strategies.
New vs. returning customer ratios indicate business health and growth potential. A healthy e-commerce business typically sees 60-70% new customers and 30-40% returning customers. If your returning customer percentage is below 20%, it suggests issues with product quality, customer service, or post-purchase experience that need immediate attention.
How Should You Use Traffic and Marketing Reports for Growth?
Traffic and marketing reports connect your promotional efforts to actual business results, helping you understand which activities generate profitable growth versus those that simply create activity. The Acquisition reports show how customers find your store and which channels deliver the highest-quality traffic.
Organic search traffic often converts better than paid advertising because these visitors are actively searching for your products. If your organic search traffic is low, it indicates opportunities for Shopify SEO improvements, including on-page SEO optimization, product description enhancement, and technical SEO fixes.
Social media traffic patterns reveal which platforms align with your audience behavior. You might discover that Instagram drives traffic but Pinterest converts better, or that TikTok brings younger customers who have different purchasing patterns than Facebook users. These insights help you tailor content and ad spend to platforms that deliver results.
Email marketing performance through Shopify Analytics shows open rates, click-through rates, and conversion rates for different campaign types. Abandoned cart emails typically convert at 15-20%, while product announcement emails might only convert at 2-3%. Understanding these benchmarks helps you set realistic expectations and optimize your email strategy.
Why Is Inventory Analysis Crucial for Small Business Success?
Inventory management can make or break a small business, and Shopify’s inventory reports provide the data needed to optimize your stock levels and product mix. The Inventory reports show stock levels, sell-through rates, and product performance metrics that inform purchasing decisions.
Products with high sell-through rates but low stock levels represent missed revenue opportunities. Conversely, products with low sell-through rates tie up valuable capital that could be invested in better-performing items. Regular inventory analysis helps you maintain the right balance between having enough stock to meet demand and avoiding excess inventory that drains cash flow.
Seasonal inventory patterns become visible through long-term analysis, allowing you to plan purchases and storage accordingly. A lawn care product store discovered their inventory peaked in March and April, requiring them to place large orders in January to meet spring demand. This insight helped them negotiate better terms with suppliers and optimize their cash flow.
The ABC analysis approach, where you categorize products based on their revenue contribution, helps prioritize inventory investment. Typically, 20% of your products generate 80% of your revenue (A products), 30% generate 15% of revenue (B products), and 50% generate 5% of revenue (C products). This classification guides inventory allocation and marketing focus.
What Are the Most Common Analytics Mistakes Small Businesses Make?
Many small business owners fall into the trap of monitoring vanity metrics that feel good but don’t drive business growth. Website traffic, social media followers, and email subscribers are important, but they’re meaningless if they don’t translate into sales and profit.
Another common mistake is making decisions based on short-term data fluctuations rather than long-term trends. A single day or week of poor performance doesn’t necessarily indicate a problem, just as a temporary spike doesn’t guarantee lasting success. Effective analytics requires looking at data over extended periods to identify genuine patterns.
Failing to segment data is another critical error that leads to misguided decisions. Overall conversion rates might look healthy, but if mobile users convert at 0.5% while desktop users convert at 3%, you’re missing crucial optimization opportunities. Shopify Analytics allows you to segment data by device, traffic source, customer type, and other variables to uncover hidden insights.
Many entrepreneurs also ignore customer feedback data that complements analytics insights. Quantitative data tells you what customers do, but qualitative feedback explains why they do it. Combining analytics with customer surveys, reviews, and support conversations provides a complete picture of your business performance.
How Can You Create Actionable Reports for Better Decision Making?
Custom reports in Shopify Analytics allow you to focus on metrics that matter most to your specific business goals. Rather than getting overwhelmed by hundreds of available metrics, create focused reports that answer specific questions about your business performance.
Weekly performance reports should include key metrics like sales, conversion rates, top products, and traffic sources. These reports help you identify trends early and make quick adjustments to marketing campaigns or inventory levels. Monthly reports should dive deeper into customer behavior, seasonal patterns, and long-term growth trends.
Setting up automated reports ensures you consistently monitor important metrics without manual effort. Shopify allows you to schedule reports via email, making it easy to stay informed even when you’re focused on other aspects of your business. This consistency is crucial for identifying problems before they become crises.
Creating benchmark reports that compare current performance to previous periods helps you understand whether your business is growing, stagnating, or declining. These comparisons should include year-over-year analysis to account for seasonal variations and month-over-month analysis to identify short-term trends.
What Tools and Integrations Enhance Shopify Analytics?
While Shopify’s built-in analytics are powerful, integrating additional tools can provide even deeper insights and automation capabilities. Google Analytics 4 integration offers advanced customer journey analysis and attribution modeling that complements Shopify’s transaction-focused data.
Heat mapping tools like Hotjar or Crazy Egg show how customers interact with your product pages and checkout process, revealing optimization opportunities that pure analytics might miss. These visual insights help you understand why customers abandon their carts or fail to convert.
Email marketing platforms like Klaviyo or Mailchimp provide advanced segmentation and automation features that work seamlessly with Shopify data. These integrations allow you to create targeted campaigns based on purchase history, browsing behavior, and customer lifetime value.
Customer service platforms that integrate with Shopify help you understand the relationship between support interactions and customer satisfaction. Customers who receive excellent support tend to have higher lifetime values and generate more referrals, making this data valuable for business growth planning.
Action Steps: Implementing Your Data-Driven Strategy
Start by conducting a comprehensive SEO audit of your Shopify store to understand your current performance baseline. This audit should include technical SEO elements, on-page SEO optimization, and local SEO factors if you serve geographic markets. Professional SEO services can provide this analysis and identify immediate optimization opportunities.
Set up your analytics tracking correctly from day one, ensuring all relevant metrics are properly configured and accessible. Many businesses discover months later that their tracking was incomplete, making historical analysis impossible. Proper setup includes configuring goals, enabling e-commerce tracking, and setting up custom dimensions for deeper analysis.
Create a regular review schedule where you analyze your analytics data and make data-driven decisions. Weekly reviews should focus on immediate issues and opportunities, while monthly reviews should examine longer-term trends and strategic adjustments. This consistency ensures you’re always working with current information.
Implement semantic SEO strategies that align with how customers actually search for your products. This approach goes beyond basic keyword optimization to understand search intent and user behavior patterns. Semantic SEO helps your products appear in more relevant searches, improving both traffic quality and conversion rates.
Conclusion: Your Path to Data-Driven Success
Shopify Analytics transforms guesswork into strategic advantage, giving small businesses the insights needed to compete effectively in today’s competitive e-commerce landscape. The businesses that thrive are those that consistently use data to guide their decisions, from inventory management to marketing spend allocation.
Remember that analytics is not a one-time setup but an ongoing process of measurement, analysis, and optimization. The insights you gain today inform tomorrow’s strategies, creating a cycle of continuous improvement that drives sustainable growth.
As you implement these strategies, consider partnering with experienced ecommerce SEO professionals who can help you maximize your Shopify store’s potential. The combination of powerful analytics and expert optimization creates a foundation for long-term business success that adapts to market changes and customer behavior shifts.
Your data is waiting to tell you exactly how to grow your business – you just need to know how to listen.